Abacus Green Deal
Transparency in sustainability

Our ESG vision
The extra-financial investment objective of the Abacus Green Deal fund is to invest in a sustainable manner, as defined in article 9 of the SFDR Regulation.
Within the investment universe, shares of European companies whose activities are directly related to sustainable development, in particular environmental sustainability, are selected.
DISTRIBUTION OF ESG SCORES
The Abacus Green Deal adopts a comprehensive extra-financial strategy. In particular, the fund’s specific analysis constrains the investment universe as a priority over the financial analysis. Within the investment universe, preference is given to shares of European companies of all capitalisations whose activities are linked to the ecological and energy transition.
Within the meaning of the SFDR regulation, the fund refers to article 9. Thus, the fund implements several approaches:
- Normative exclusions: excluding companies involved in controversial weapons and companies found in violation of the 10 principles of the UN Global Compact and the OECD Guidelines;
- Sectoral exclusions: fossil fuels, coal-fired power, tobacco and the adult entertainment industry;
- “Best-in-Class”;
- ESG risk and impact analysis;
- Greenhouse gas emissions analysis, scopes 1,2,3;
- Positive impact and sustainability analysis;
- Dialogue with companies to deepen our analysis and encourage positive impact;
- Risk and controversy monitoring.
Do no harm
“This product aims at investing sustainably.”
| Indicateurs applicables aux investissements dans des sociétés | ||||||||
| Indicateur d’incidences négatives sur la durabilité | Élément de mesure | Incidences 2024 | Incidences 2023 | Explication | Couverture 2024 | Couverture 2023 | Mesures prises | |
| Émissions de gaz à effet de serre | 1. Émissions de GES | Émissions de GES de niveau 1 | 1991.88 | 2635.71 | En Tonnes eq CO2 | 0.97 | 0.95 | Nous avons mis en place une nouvelle méthodologie de calcul des émissions de CO2 pour nos fonds. Nous avons pris en compte le poids de l'entreprise dans le portefeuille, notre part dans le capital, et le taux de couverture de l'indicateur pour obtenir les données les plus fiables. |
| Émissions de GES de niveau 2 | 623.55 | 688.4 | En Tonnes eq CO2 | 0.97 | 0.95 | |||
| Émissions de GES de niveau 3 | 5905.1 | 4067.65 | En Tonnes eq CO2 | 0.93 | 0.85 | |||
| Émissions totales de GES de niveau 1 et 2 | 2615.43 | 3324.11 | En Tonnes eq CO2 | 0.97 | 0.95 | |||
| Émissions totales de GES de niveau 1, 2 et 3 Scope 1,2,3 | 8520.53 | 7391.76 | En Tonnes eq CO2 | 0.93 | 0.85 | |||
| 2. Empreinte carbone | Carbon footprint Scope 1,2 | 120.02 | 154.19 | scope 1+2 / M€ investis | 0.97 | 0.95 | Suivi régulier | |
| Carbon footprint Scope 1,2,3 | 391.01 | 342.78 | scope 1+2+3 / M€ investis | 0.93 | 0.85 | Suivi régulier | ||
| 3. Intensité de GES des sociétés bénéficiaires des investissements | Intensité de GES des sociétés bénéficiaires des investissements Scope 1,2 | 136.85 | 226.16 | scope 1+2/ CA | 0.98 | 0.95 | Suivi régulier | |
| Intensité de GES des sociétés bénéficiaires des investissements Scope 1,2,3 | 577.92 | 629.59 | scope 1+2+3/ CA | 0.94 | 0.86 | Suivi régulier | ||
| 4. Exposition à des sociétés actives dans le secteur des combustibles fossiles | Part d’investissement dans des sociétés actives dans le secteur des combustibles fossiles | Le secteur des combustibles fossiles est exclu de l'univers d'investissement. | Politique d'exclusion | |||||
| Energie | 5. Part de consommation et de production d’énergie non renouvelable | Part de la consommation et de la production d’énergie des sociétés bénéficiaires d’investissement qui provient de sources d’énergie non renouvelables, par rapport à celle provenant de sources d’énergie renouvelables, exprimée en pourcentage du total des sources d’énergie | 0.28 | 0.66 | % | 0.28 | 0.74 | Suivi régulier |
| 6. Intensité de consommation d’énergie par secteur à fort impact climatique | Consommation d’énergie en GWh par million d’euros de chiffre d’affaires des sociétés bénéficiaires d’investissements, par secteur à fort impact climatique | |||||||
| Secteur A | 0 | GWH/ M€ CA | Suivi régulier | |||||
| Secteur C | 0.64 | 0.72 | GWH/ M€ CA | 0.64 | 0.88 | |||
| Secteur E | 0.9 | 0.41 | GWH/ M€ CA | 0.9 | 1 | |||
| Secteur F | 0.02 | 0.1 | GWH/ M€ CA | 0.02 | 0.63 | |||
| Secteur G | 0.01 | 0.01 | GWH/ M€ CA | 0.01 | 1 | |||
| Secteur H | 1.482 | 0 | GWH/ M€ CA | 1 | ||||
| Secteur L | 0.2 | 0 | GWH/ M€ CA | 1 | ||||
| Biodiversité | 7. Activités ayant une incidence négative sur des zones sensibles sur le plan de la biodiversité | Part des investissements effectués dans des sociétés ayant des sites/établissements situés dans ou à proximité de zones sensibles sur le plan de la biodiversité, si les activités de ces sociétés ont une incidence négative sur ces zones | Aucune donnée disponible | |||||
| Eau | 8. Rejets dans l’eau | Tonnes de rejets dans l’eau provenant des sociétés bénéficiaires d’investissements, par million d’euros investi, en moyenne pondérée | 13.65 | 3031484.21 | Les émissions d'eau sont inconnues. Les données recueillies font référence à la consommation d'eau en Km3/ M€. | 0.53 | 0.61 | Suivi régulier |
| Déchets | 9. Ratio de déchets dangereux et de déchets radioactifs | Tonnes de déchets dangereux et de déchets radioactifs produites par les sociétés bénéficiaires d’investissements, par million d’euros investi, en moyenne pondérée | 749.26 | 437.98 | Tonnes / M€ | 0.5 | 0.57 | Suivi régulier |
| "INDICATEURS LIÉS AUX QUESTIONS SOCIALES, DE PERSONNEL, DE RESPECT DES DROITS DE L’HOMME ET DE LUTTE CONTRE LA CORRUPTION ET LES ACTES DE CORRUPTION" | ||||||||
| Les questions sociales et de personnel | 10. Violations des principes du pacte mondial des Nations unies et des principes directeurs de l’OCDE pour les entreprises multinationales | Part d’investissement dans des sociétés qui ont participé à des violations des principes du Pacte mondial des Nations unies ou des principes directeurs de l’OCDE à l’intention des entreprises multinationales | Les entreprises qui violent les principes du Pacte mondial Global Compact et des Principes directeurs de l'Organisation de coopération et de développement économiques (OCDE) à l'intention des entreprises multinationales sont exclues de l'univers d'investissement. | Politique d'exclusion | ||||
| 11. Absence de processus et de mécanismes de conformité permettant de contrôler le respect des principes du Pacte mondial des Nations unies et des principes directeurs de l’OCDE à l’intention des entreprises multinationales | Part d’investissement dans des sociétés qui n’ont pas de politique de contrôle du respect des principes du Pacte mondial des Nations unies ou des principes directeurs de l’OCDE à l’intention des entreprises multinationales, ni de mécanismes de traitement des plaintes ou des différents permettant de remédier à de telles violations | 0.32 | 0.26 | Concerne les entreprises qui ne sont pas signataires du Pacte mondial des Nations Unies | 0.99 | 0.89 | Suivi régulier | |
| 12. Écart de rémunération entre hommes et femmes non corrigé | Écart de rémunération moyen non corrigé entre les hommes et les femmes au sein des sociétés bénéficiaires des investissements | Aucune donnée crédible n'était disponible | ||||||
| 13. Mixité au sein des organes de gouvernance | Ratio femmes/hommes moyen dans les organes de gouvernance des sociétés concernées, en pourcentage du nombre total de membres | 0.37 | 0.36 | % | 0.98 | 0.99 | Suivi régulier | |
| 14. Exposition à des armes controversées (mines antipersonnel, armes à sous-munitions, armes chimiques ou armes biologiques) | Part d’investissement dans des sociétés qui participent à la fabrication ou à la vente d’armes controversées | Les entreprises dont les activités sont liées à des armes controversées sont exclues de l'univers d'investissement. | Politique d'exclusion | |||||
| Indicateurs applicables aux investissements dans des émetteurs souverains ou supranationaux | ||||||||
| Indicateur d’incidences négatives sur la durabilité | Élément de mesure | Incidences 2023 Juin | Explication | Couverture 2023 Juin | Mesures prises | |||
| Environmental | 15. Intensité de GES | Intensité de GES des pays d’investissement | The funds do not invest in sovereigns and supranationals | |||||
| Social | 16. Pays d’investissement connaissant des violations de normes sociales | Nombre de pays d’investissement connaissant des violations de normes sociales (en nombre absolu et en proportion du nombre total de pays bénéficiaires d’investissements), au sens des traités et conventions internationaux, des principes des Nations unies ou, le cas échéant, du droit national. | The funds do not invest in sovereigns and supranationals | |||||
| Indicateurs applicables aux investissements dans des actifs immobiliers | ||||||||
| Indicateur d’incidences négatives sur la durabilité | Élément de mesure | Incidences 2022 | Explication | Couverture 2022 | Mesures prises | |||
| Combustibles fossiles | 17. Exposition à des combustibles fossiles via des actifs immobiliers | Part d’investissement dans des actifs immobiliers utilisés pour l’extraction, le stockage, le transport ou la production de combustibles fossiles | Les fonds n'investissent pas dans des actifs immobiliers | |||||
| Efficacité énergétique | 18. Exposition à des actifs immobiliers inefficaces sur le plan énergétique | Part d’investissement dans des actifs immobiliers inefficaces sur le plan énergétique | Les fonds n'investissent pas dans des actifs immobiliers | |||||
| Autres indicateurs relatifs aux principales incidences négatives sur les facteurs de durabilité | ||||||||
| INDICATEURS CLIMATIQUES ET AUTRES INDICATEURS RELATIFS À L’ENVIRONNEMENT | ||||||||
| Émissions | 4. Investissements dans des sociétés n’ayant pas pris d’initiatives pour réduire leurs émissions de carbone | Part d’investissement dans des sociétés qui n’ont pas pris d’initiatives pour réduire leurs émissions de carbone aux fins du respect de l’accord de Paris | 0.07 | 0.05 | % | 1 | 0.99 | Suivi régulier |
| Eau, déchets et autres matières | 7. Investissements dans des sociétés sans politique de gestion de l’eau | Part d’investissement dans des sociétés sans politique de gestion de l’eau | 0.31 | 0.28 | % | 0.88 | 0.91 | Suivi régulier |
| INDICATEURS LIÉS AUX QUESTIONS SOCIALES, DE PERSONNEL, DE RESPECT DES DROITS DE L’HOMME ET DE LUTTE CONTRE LA CORRUPTION ET LES ACTES DE CORRUPTION | ||||||||
| Questions sociales et de personnel | 1. Investissements dans des entreprises sans politique de prévention des accidents du travail | Part d’investissement dans des sociétés sans politique de prévention des accidents du travail | 0.04 | 0.03 | % | 0.96 | 0.97 | Suivi régulier |
| 2. Taux d’accidents | Taux d’accidents dans les sociétés concernées, en moyenne pondérée | 4.8 | 8.9 | Se réfère au taux total d'incidents enregistrable | 0.79 | 0.78 | Suivi régulier | |
| 4. Absence de code de conduite pour les fournisseurs | Part d’investissement dans des sociétés sans code de conduite pour les fournisseurs (lutte contre les conditions de travail dangereuses, le travail précaire, le travail des enfants et le travail forcé) | 0.07 | 0.09 | Les données concernent les entreprises qui ne prennent pas en compte les critères ESG (pas seulement sociaux) dans la gestion de leur chaîne d'approvisionnement. | 0.99 | 0.95 | Suivi régulier | |
| 6. Protection insuffisante des lanceurs d’alerte | Part d’investissement dans des entités qui n’ont pas défini de politique de protection des lanceurs d’alerte | 0.05 | 0.16 | % | 0.99 | 0.89 | Suivi régulier | |
| Droits de l’homme | 9. Absence de politique en matière de droits de l’homme | Part d’investissement dans des entités ne disposant pas d’une politique en matière de droits de l’homme | 0.13 | 0.05 | % | 0.98 | 0.97 | Suivi régulier |
| Lutte contre la corruption et les actes de corruption | 15. Absence de politique de lutte contre la corruption et les actes de corruption | Part d’investissement dans des entités ne disposant pas d’une politique de lutte contre la corruption et les actes de corruption conforme à la convention des Nations unies contre la corruption | 0.02 | 0.06 | % | 1 | 0.96 | Suivi régulier |
The Fund ensures that it is aligned with the OECD Guidelines for Multinational Enterprises and the UN Guiding Principles on Business and Human Rights, including the principles and rights set out in the eight core conventions identified in the International Labour Organisation’s Declaration on Fundamental Principles and Rights at Work and the Human Rights Charter.
This alignment is verified and monitored at the level of the investable universe. A company found to be in violation of these Principles is excluded from the investable universe.
Sustainable investment objective

Objective of contributing to the ecological and energy transition
Energy generation
Energy efficiency
Circular economy
Sustainable resources
Innovative technologies
Ensuring through investment in our five themes of activity

Measuring sustainability through these five environmental objectives
Investment strategy
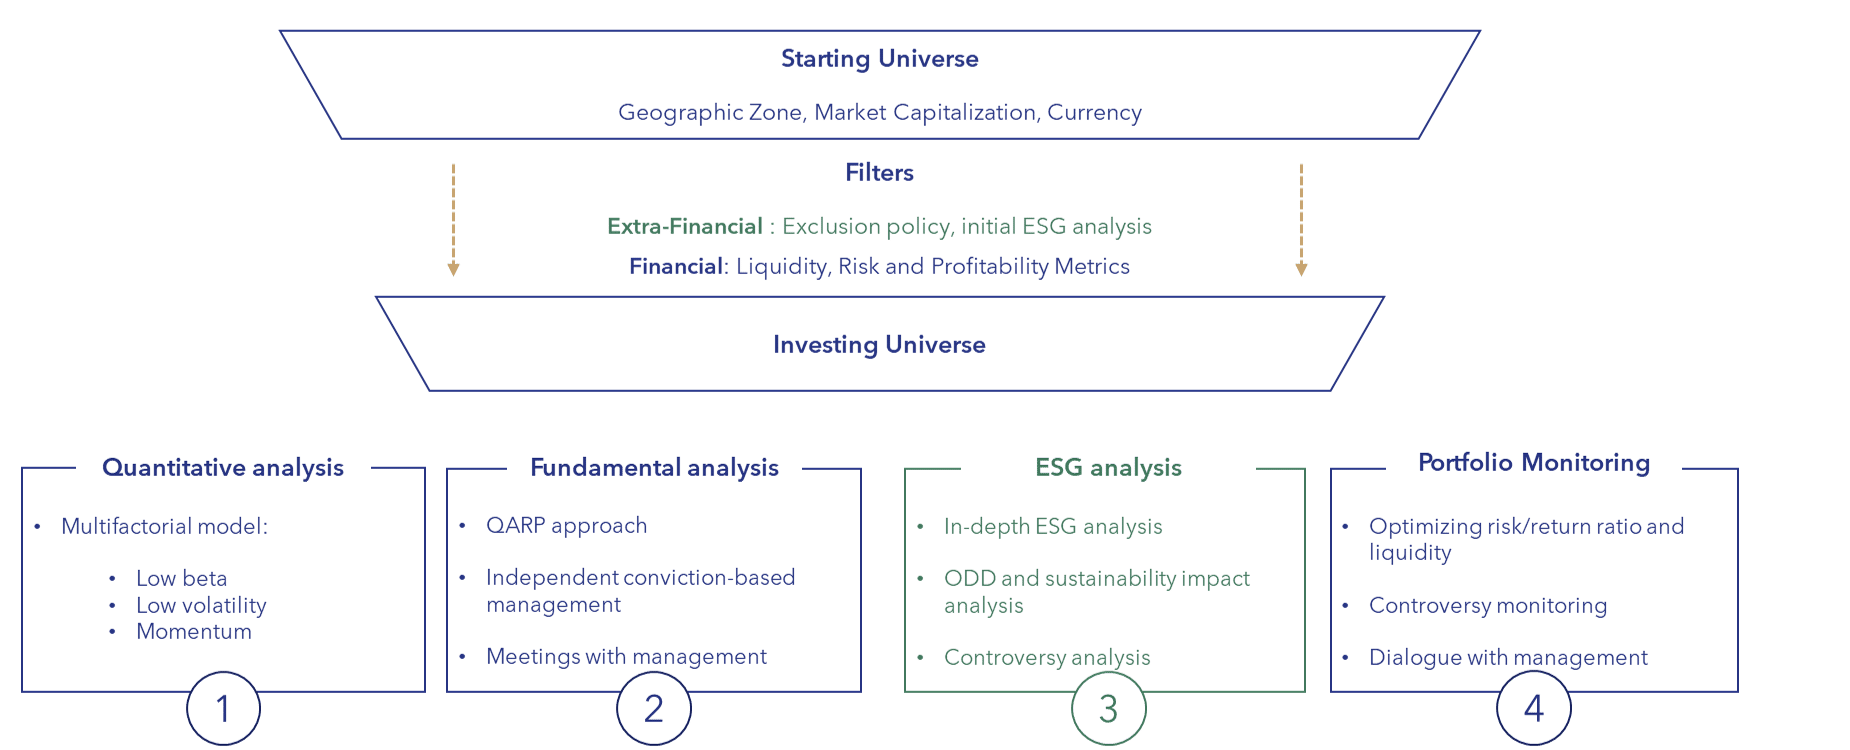
1 – OUR PHILOSOPHY
Our socially responsible and sustainability-conscious convictions drive our extra-financial strategy and investment guidelines.
2 – RESEARCH AND ANALYSIS
We perform our due diligence and ESG analysis on each company.
We conduct an in-depth analysis of the company’s activities, responsible approach and corporate culture.
Our analysis is done in-house using a proprietary tool.
With raw data, collected directly from the company, its reports and publications.
Our analysis is based on quantitative data, supplemented and contextualised by qualitative data.
3 – COMMITMENT AND STEWARDSHIP
We actively engage the company in order to collect data from the management and to discuss possible ways of improvement.
4 – KPI AND TRANSPARENCY
In order to ensure a minimum ESG threshold, for each fund a specific approach is assigned.
In addition, we strive to achieve an ESG performance of the portfolio above that of its benchmark.
We analyse and monitor around 130 KPIs including footprint and emissions intensity for all portfolios. We consider scopes 1, 2 and 3.
The ESG performance of our funds is subject to regular monthly and annual reporting.
The 5 postulates of our extra-financial strategy
REDUCE THE RISKS
Preventing negative impact on value and the environment
Normative and sectoral exclusions
ESG analysis based on double materiality
Pragmatic and objective management of controversies
SEIZE THE OPPORTUNITIES
Focusing on and encouraging positive impact
Positive impact measurement
Constructive and proactive dialogue
Objectives of the fund
Minimum investability threshold
The entire universe is rated and 20% of worst rated companies are excluded
ESG analysis coverage rate
More than 90% by weighting
ESG rating
Higher than benchmark
Emissions intensity
Lower than the benchmark
Exposures
Exposure to sustainable development
Exposure to liability risk is assessed through in-depth ESG analysis, analysing more than 130 criteria from the four pillars: environmental, social, societal, and governance. The ESG analysis captures the management company’s exposure to liability risk, which is defined as the legal risk of companies being sued and/or convicted for violating their ESG constraints and obligations.
Sustainable development exposure is assessed through the Sustainable Development Goals (SDGs), taking into account the direct and indirect contribution of the invested companies and assigning a score from 0 to 100.
The sustainable investment rate is calculated internally by taking into account three criteria: substantial contribution to one or more of the SDGs, absence of significant harm and good governance.
The sustainability calculation distinguishes between environmental goals related to clean water (MDG 6), clean energy (MDG 7), sustainable consumption (MDG 12), combating climate change (MDG 13) and biodiversity (MDG 15), and social goals related to human health (MDG 3), quality education and training (MDG 4), gender equality (MDG 5), decent work (MDG 8), and reducing inequality (MDG 10).
ESG ratings, both total and by pillar, are calculated by our proprietary tool for all invested companies. The tool is developed on a dual materiality basis, taking into account the sustainability risks to the company and the risk of the company’s negative impact on the sustainability factors.
The contribution to the SDGs is assessed by the direct contribution to one or more of the goals as a result of the company’s activity, and by the indirect contribution as a result of the company’s approach, behaviour and culture independently of the activity.
Monitoring the sustainable investment objective
Measuring sustainability
Ensures the construction of a truly sustainable portfolio
Three criteria:
- substantial contribution to one or more SDGs
- absence of significant harm
- good governance.
Significant contribution to:
Control during the life of the asset
1 – Monitoring the universe
Initial analysis
2 – Portfolio monitoring
In-depth analysis
3 – Pre-trade control
4 – Post-trade control
5 – Commitment
Methodology
Normative and sectoral exclusions
Best in class
ESG analysis based on double materiality
Positive impact measurement
Analysis of greenhouse gas emissions
Sustainable investment goal
The fund calculates the sustainable investment rate for issuers. This calculation is carried out in-house using a proprietary tool that takes three criteria into account: substantial contribution to one or more sustainable development goals (SDGs), absence of significant harm and good governance.
For more information:
Sources and data
External data - internal tools and analysis
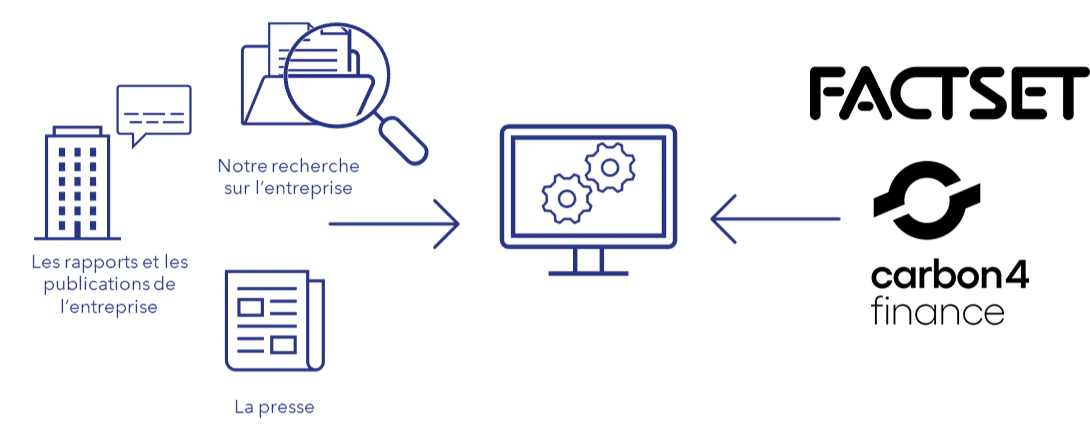
We attach great importance to the development of proprietary models built on our expertise to provide tangible added value in the application of our non-financial strategy. Our analysis and monitoring tools respect this principle and aim to offer results that we control as a whole.
Our proprietary tools developed on the basis of international standards
The management team is responsible for scientific, technical and regulatory monitoring in terms of tool development and extra-financial management. It relies on international standards:
- UN Sustainable Development Goals (SDGs) for their granularity and in-depth, global approach.
- The Global Reporting Initiative (GRI) and Carbon Disclosure Project (CDP), for their relevant publications and their work on improving transparency in the extra-financial field;
- Documentary sources published by European Union bodies such as the European Securities and Markets Authority (ESMA) and the European Environment Agency (EEA).
- Publications from national public authorities such as, for France, the French Environment and Energy Management Agency (ADEME) and the French Financial Management Agency (AFG);
Methodological limitations
The ESG analysis adopted is based mainly on qualitative and quantitative data provided by the companies themselves. It therefore depends on the heterogeneity of the quality of this information and the quantity of data available. To fill any gaps, the fund contacts companies to obtain the necessary information through ESG questionnaires.
ESG data received from third parties may be incomplete, inaccurate or unavailable from time to time. There may also be a size bias, as large caps have more budget allocated to their responsible and CSR approach.
Carbon analysis is limited by the lack of a clearly defined reporting framework. The methods used by companies to calculate their CO2 emissions may vary in quality as well as in quantity. Thus, the data published by companies may be based on different perimeters of induced emissions (Scope 1, 2, 3). In particular, Scope 3 emissions are often unavailable. All of this can affect the calculation of the portfolio’s overall footprint.
Duty of care
Monitoring of the investable universe :
- Exclusions according to our Exclusion Policy
- Analysis of controversies and risks
- Entitled ESG analysis, with the exclusion of 20% of the worst rated companies (Best in Universe)
Daily monitoring and updating
Portfolio monitoring :
- In-depth ESG analysis
- Impact and sustainability analysis
- Controversy monitoring
Daily monitoring, data update at least annually, ad hoc in case of controversies
Spot check of investability and ESG risk before an order is filled
Updating and monitoring daily ESG ratios.
Daily monitoring of the achievement of ESG objectives within the portfolio:
- Rating above the benchmark
- ESG analysis coverage rate >90%.
- Investability rate >90%.
We communicate with companies on the subject of their responsible approach.
We make contact on several occasions:
- Occasionally, in order to deepen our analysis
- Regularly at ESG forums
- At the request of the company
The management team is also responsible for the identification, measurement and control, at the first level, of the risks related to the implementation of the extra-financial approach within the managed portfolios. These risks are controlled at the second level by the management company’s Middle Office Risk, with the support of the permanent control delegate.
Commitment
Philippe Hottinguer Gestion wishes to promote the consideration of the extra-financial sphere among its clients and investors. The company encourages the integration of ESG factors into the decision-making processes and activities of the companies in which it invests.
The company is committed to the UN Principles for Responsible Investment, to the 6 Principles for Responsible Investment, including those relating to shareholder engagement. We are committed to
- Being active shareholders, integrating ESG issues into our shareholding policies and procedures.
- Encourage the companies in which we invest to publish information about their ESG practices.
- Promote the adoption and implementation of the Principles in the investment industry.
- Cooperate to improve the effectiveness of our implementation of the Principles.
To this end, we have planned several engagement approaches.
Collaborative commitment
Promoting and sharing knowledge on sustainable finance issues
Forums, conferences…
Collaborative platforms
Individual commitment
Protecting and improving the investment process, monitoring ESG performance and encouraging the positive impact of assets
ESG Questionnaire
Constructive and proactive dialogue
Votes at meetings
Aligned with the company’s investment objectives and principles
Votes at meetings
Achieving the sustainable investment objective
Benchmark index: Eurostoxx
The benchmark follows the same ESG rating strategy with the same KPIs, calculation methods and is rated using the same variable materiality as the portfolio. Compliance with the portfolio’s sustainability objectives is measured daily. This is done in part by using the ESG rating of the benchmark. Other KPIs, such as carbon intensity or footprint, are monitored regularly and reported on a monthly basis. In this sense, the benchmark is continuously monitored and ensured to be aligned with the environmental and social characteristics promoted by the financial product.
The respective ESG scores of the investable universe and the benchmark are weighted by their capitalisation and updated daily to ensure continuous alignment with each ESG objective of the portfolio.
We use the same methodology for calculating the ESG factors of the index and the portfolio. Our responsible investment policy details the methodology applied.


